Introduction
Splunk is a software platform widely used for monitoring, searching, analyzing and visualizing the machine-generated data in real time. It performs capturing, indexing, and correlating the real time data in a searchable container and produces graphs, alerts, dashboards and visualizations. Splunk provides easy to access data over the whole organization for easy diagnostics and solutions to various business problems.
Features of Splunk
-Accelerate Development & Testing
-Allows you to build Real-time Data Applications
-Generate ROI faster
-Agile statistics and reporting with Real-time architecture
-Offers search, analysis and visualization capabilities to empower users of all types
Below is a step by step (with screenshots) and a video demonstration of how to create a basic chart in Splunk:
Creating a Basic Chart In Splunk
Summary
In this demonstration I created charts based on search queries in Splunk. I also showed the different vizualization options that can be used to display data that is already ingested into Splunk (Bar, Pie and Area Charts).
Environments and Technologies Used
-Splunk Enteprise (Local Install)
-Data in the form of .csv files
Prerequisites
In order to complete this lab you need the following:
-Splunk installed to a local or virtual machine
-Data files to uploaded into Splunk
– Here is the tutorial on uploading data into Splunk
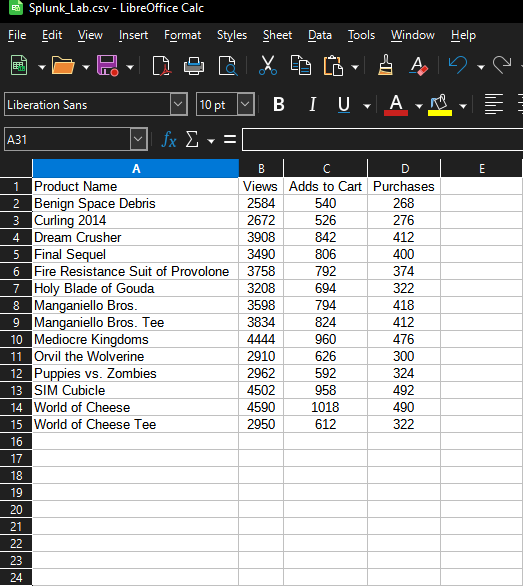
– Here is where you can find the csv data file I used for this tutorial.
-You can sign up and get a free trial for Splunk Enterprise here.
Main Steps
Step 1. Log into Splunk

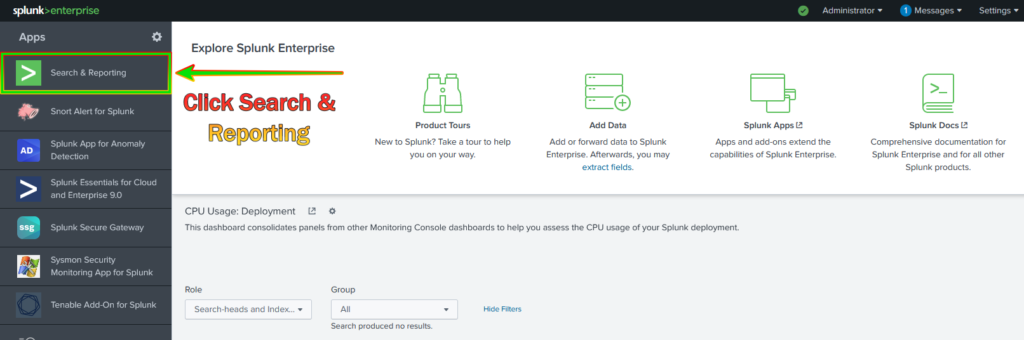
Step 2. Go into the Search & Reporting Area
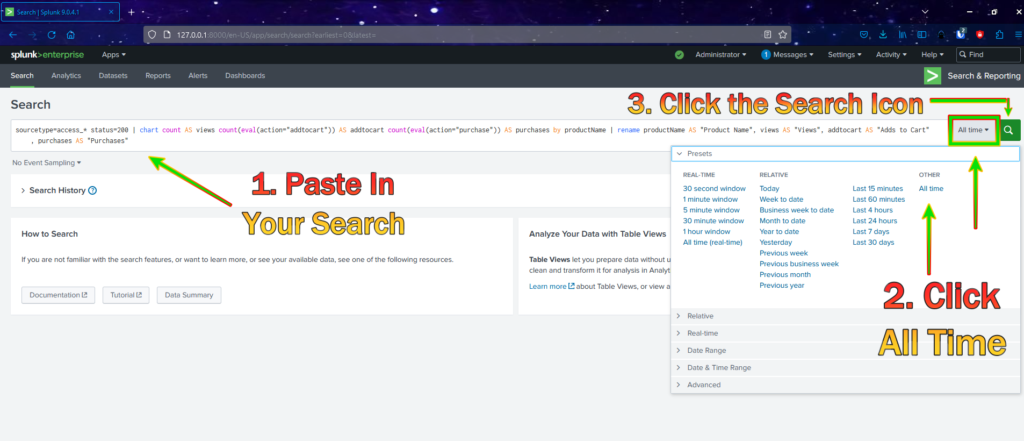
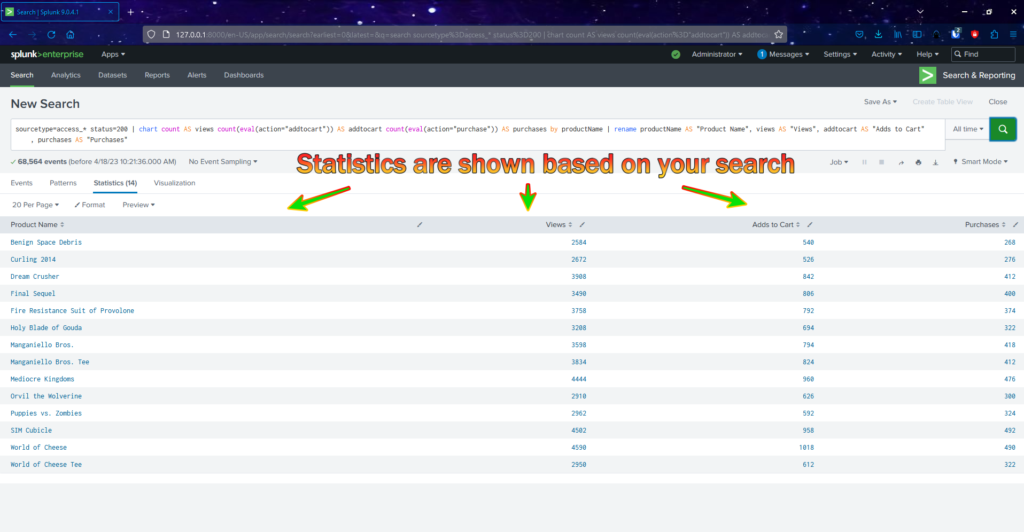
Step 3. Paste your search query into the search bar and click the search icon
Step 4. Results are shown on the screen
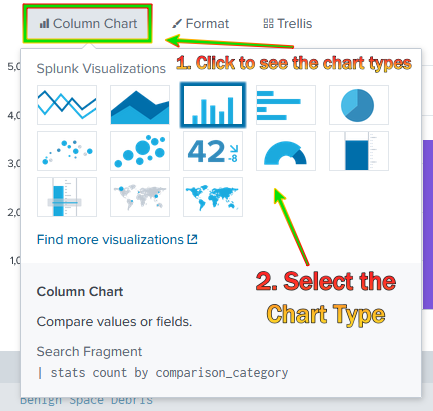
Step 5. Click visualizations on the left which will show the results in chart form. There are several to choose from.

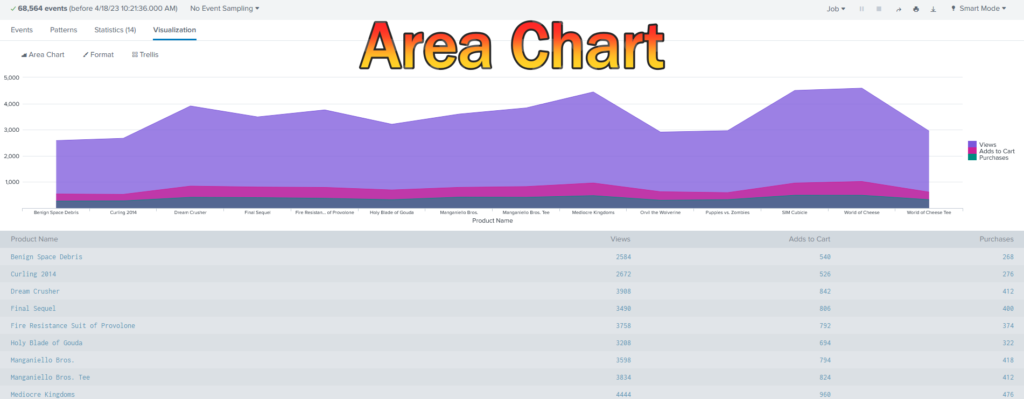
Area Chart
Bar Chart

Pie Chart
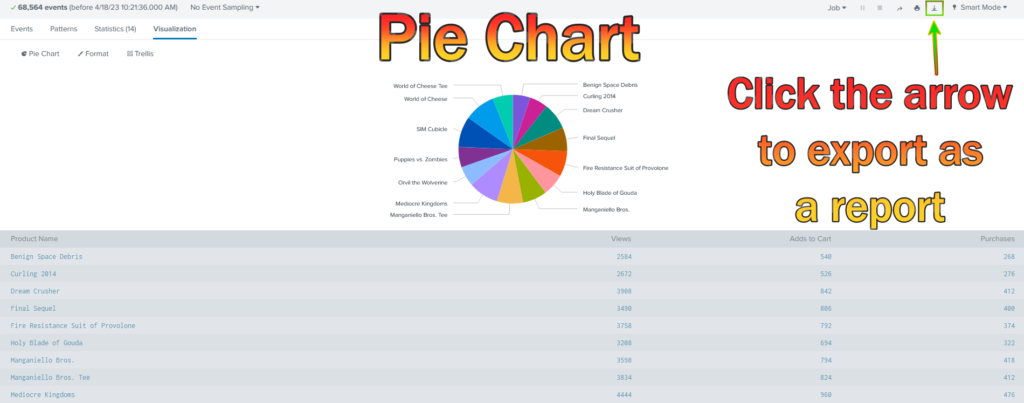
Step 7. You can export your results as a .csv, json or xml
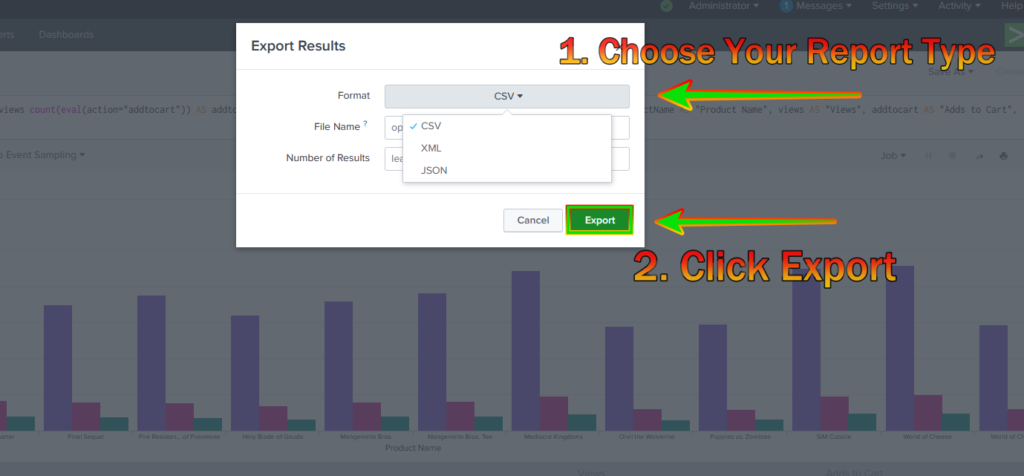
Report in .csv format