For this project, I built a HoneyNet and SOC in Microsoft Azure. To accomplish this, I provisioned all of the resources necessary for a cloud infrastructure including virtual machines, flow logs for each VM, a log analytics workspace to ingest the log data, a key vault, a storage account, vnets, network security groups and a SIEM (Azure Sentinel). After provisioning, I left the resources exposed to the internet in order to gather attack data for 24 hours. The environment was then hardened and left on for another 24 hours. Finally, I gathered log data and created a spreadhseet to show the change in traffic patterns in the 24 hour period after the environment was hardened.
Environments and Architecture Technologies Used
Microsoft Azure (Cloud Platform)
Resource Groups
Azure Virtual Machines (2 Windows, 1 Linux)
Log Analytics Workspace
Azure Sentinel (SIEM)
Key Vault
Storage Account
Network Security Groups
Microsoft Defender for Cloud (Cloud-native Application Protection Platform (CNAPP))
Remote Desktop Protocol (Used for logging in to the VMs)
OSB Studio (For recording some my labs showcasing the procedures)
Security Metrics Used for Queries in the Log Analytics Workspace
Syslog (For Linux Event Logs)
SecurityIncident (For Sentinel Created Incidents)
SecurityAlert (For Alerts Triggered in the Log Analytics Work Space)
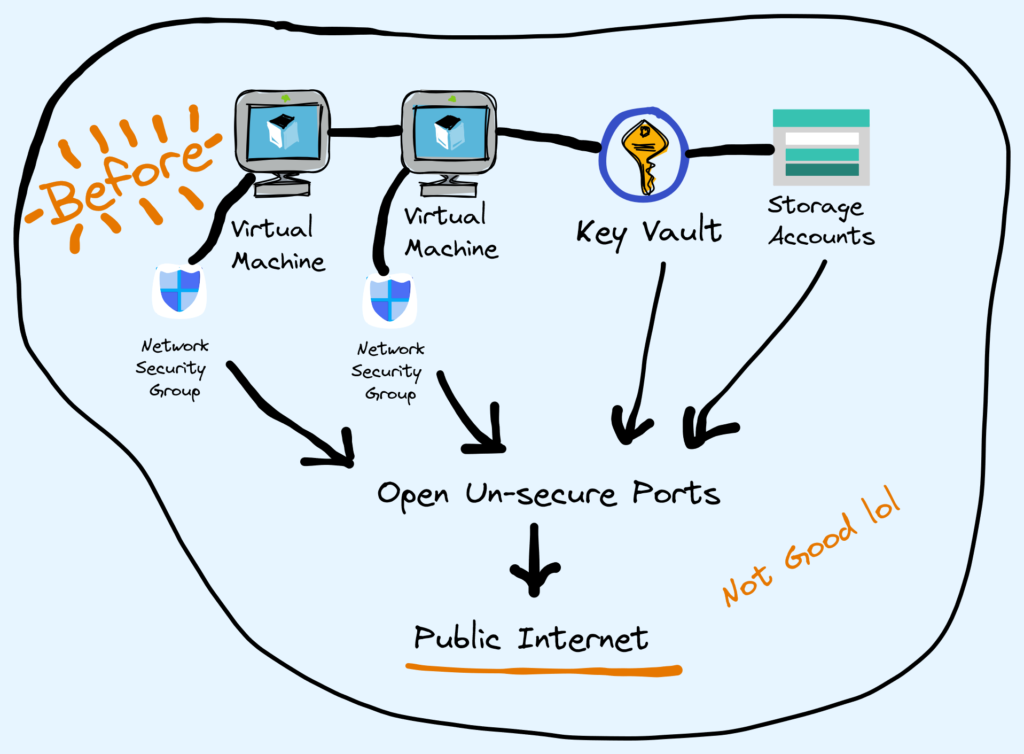
Before hardening, all resources were exposed to the internet with public endpoints and the Network Security Group firewalls were wide open.
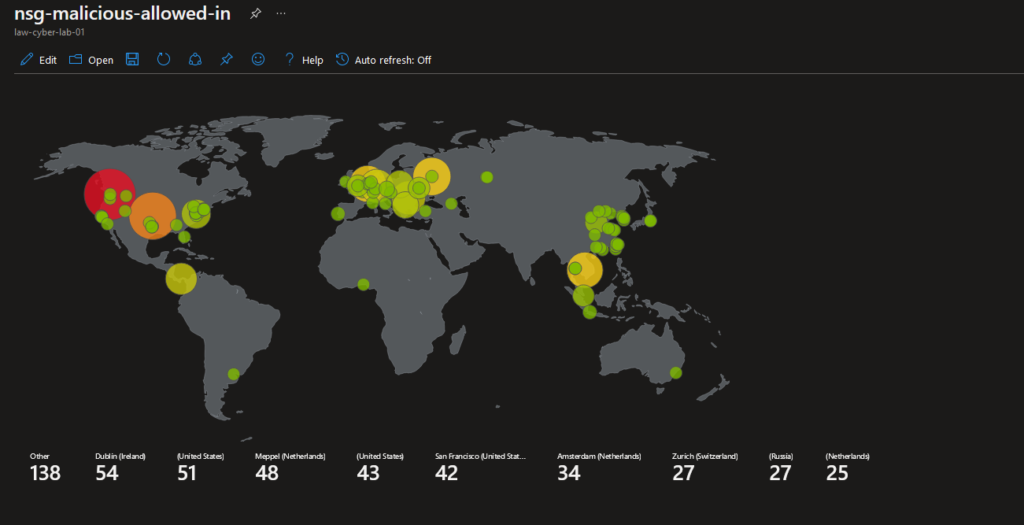
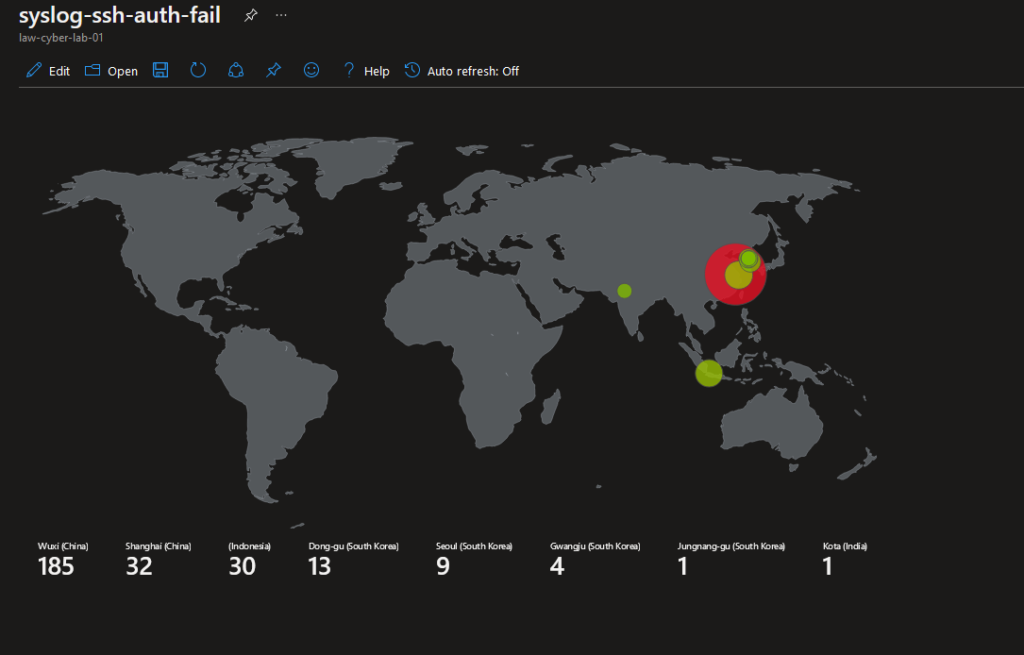
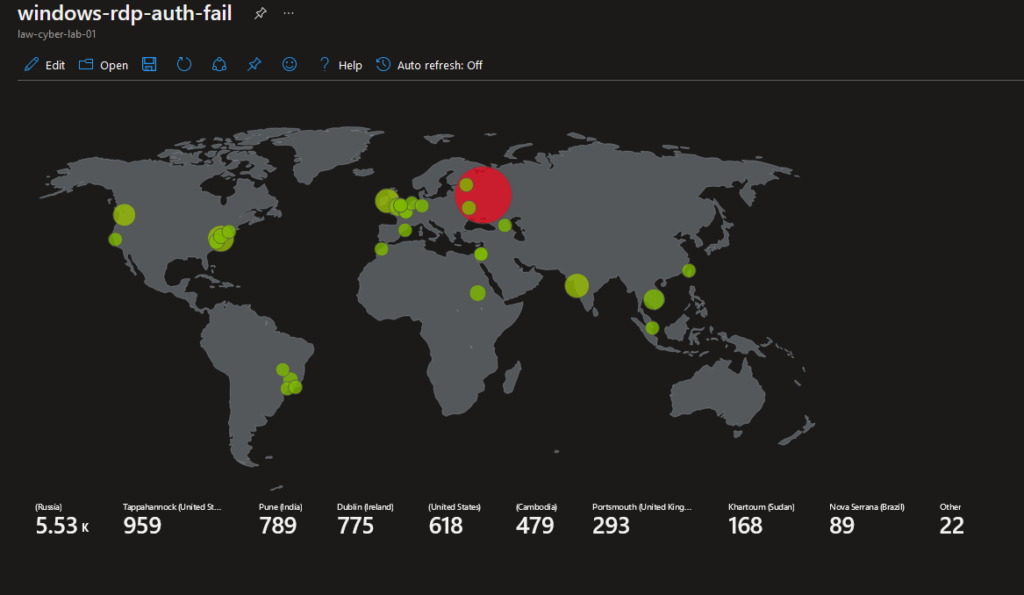
Attack Maps Before Environment Hardening
These maps show malicious traffic attempting to penetrate the Azure environment before security controls were implemented.
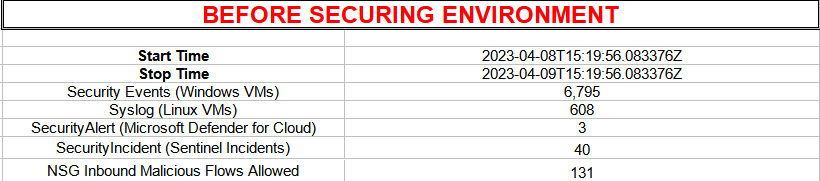
Metrics Before Implementing Security Controls
The below table displays the metrics that were measured while the environment was insecure for 24 hours:
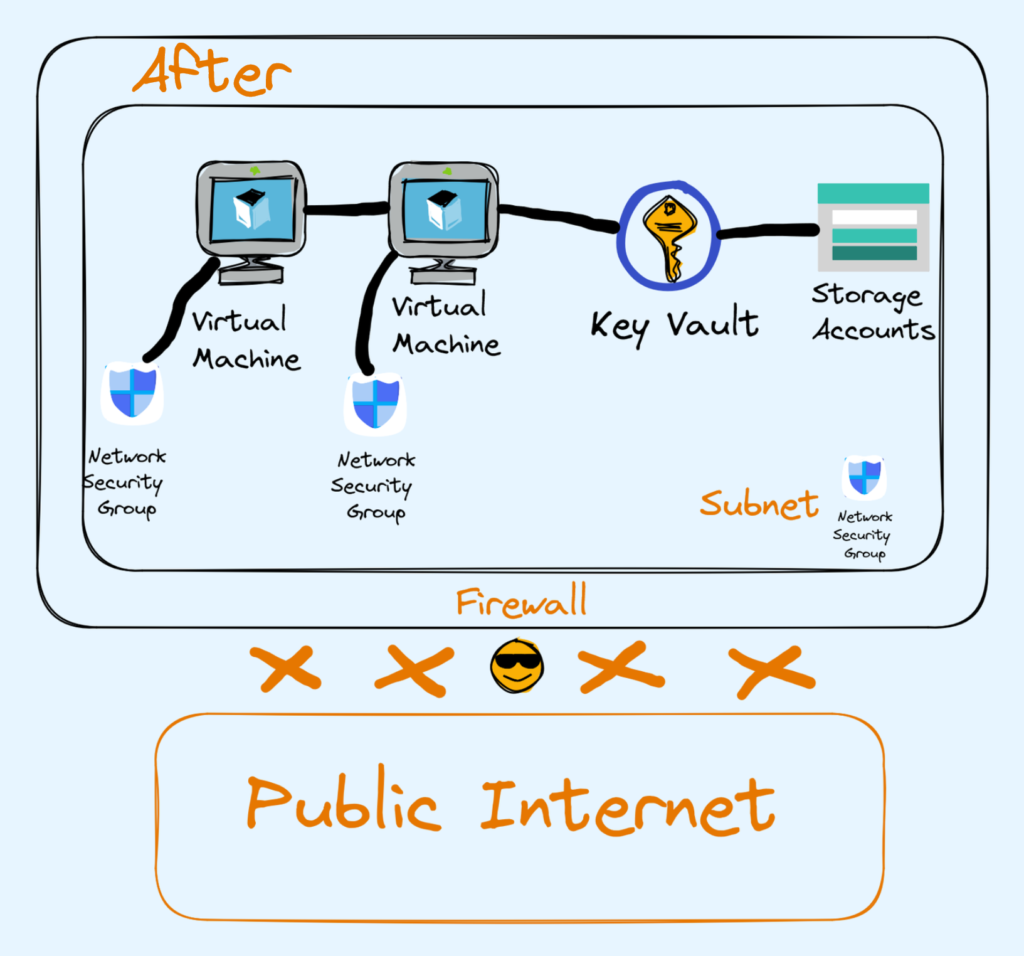
Architecture After Hardening
After hardening, the VMs had their exposed ports (RDP/SSH) closed, the resources were all secured behind firewalls and a v-net with it’s own network security group. Firewall rules were then set to only allow my workstation PC to access any of the resources in the environment for purposes of gathering log traffic data.
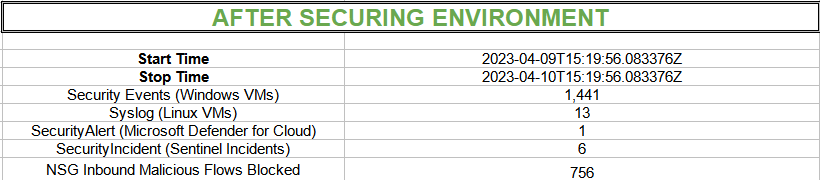
Metrics After Implementing Security Controls
The below table displays the metrics that were measured after the environment was hardened with security controls for 24 hours.
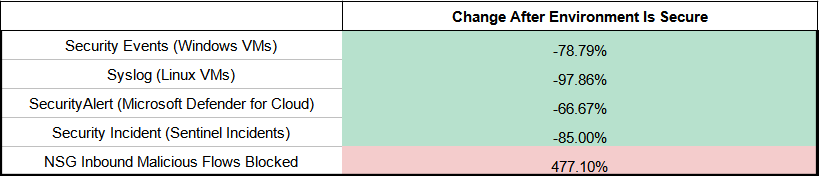
Rate of Change
Conclusion
In this project I constructed a honeynet in Microsoft Azure with log sources that were integrated into a log analytics workspace. I also deployed Azure Sentinel in order to trigger alerts and incidents based on the log data from the log analytics workspace. There were metrics measured 24 hours after the creation all insecure resources and then 24 hours after implementing security controls. As seen in the metric data tables there was a dramatic drop in incidents because security controls were put in place which illustrates their effectiveness.
Please note: This project was done in a controlled environment so results will vary based on applied situation.